
Part 3: Using Random Forest to Determine Factors in Trip Generation
Methodology
Data was pulled in and joined to capture demographic data from Part 1 and distance to amenities from Part 2. It was aggregated by stations. Using Random Forest from Scikit Learn, a model was built to determine factors affecting trip generation. The features were selected based upon the Pearson correlation charts and through trial and error methods to obtain better performing models.
Pearson Correlation
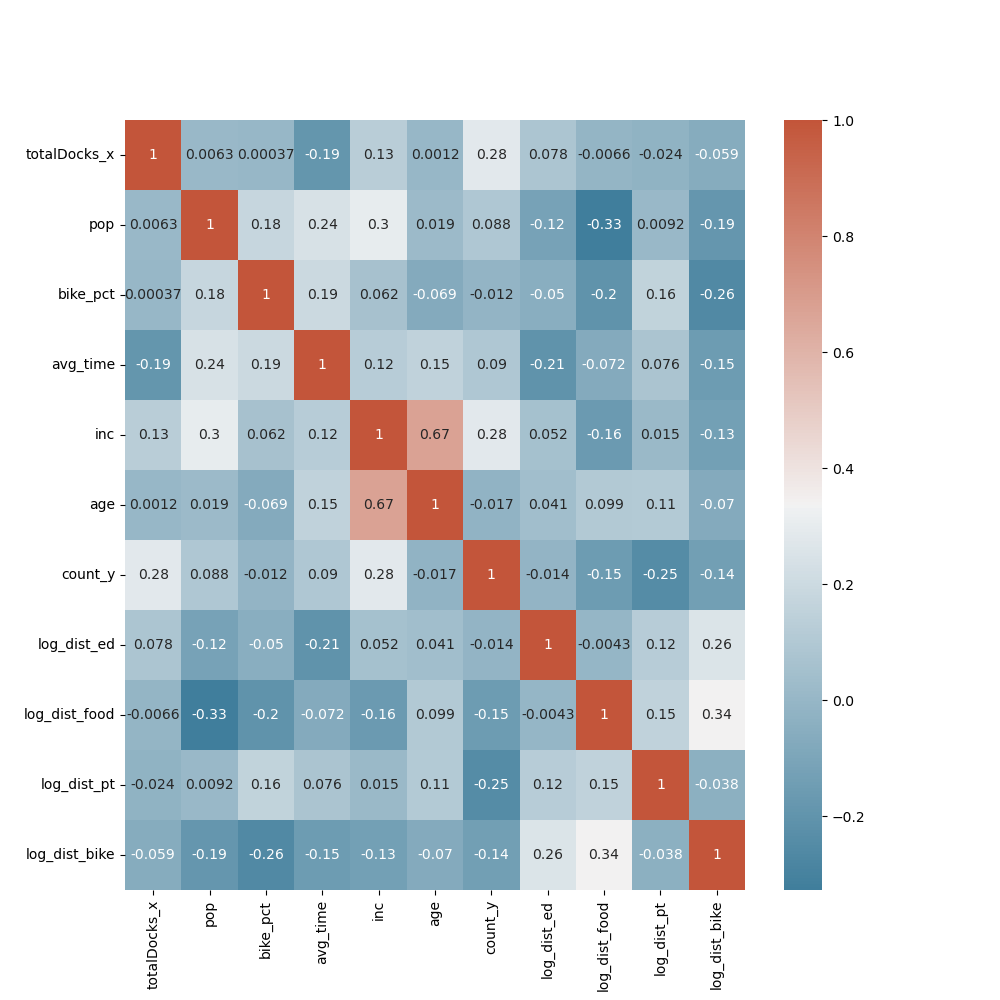
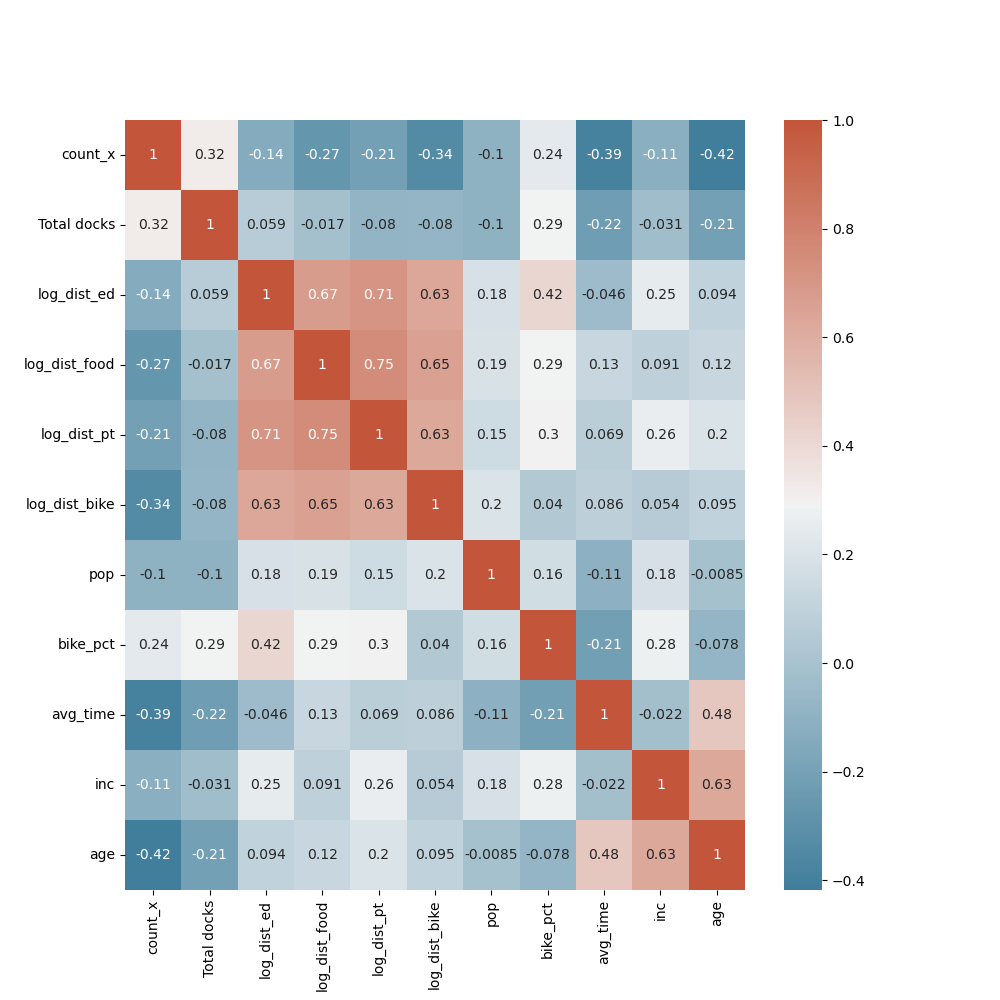
The correlation chart below shows the correlation between variables used in the analysis and counts of trips. This was referred to while doing the feature selection for machine learning.
Pearson Correlation: Philadelphia
Pearson Correlation: Boston
Feature Importance
Feature importance is used to compare which features are important for trip generation based on the best model. Following are the feature importance charts for Philadelphia and Boston.
Philadelphia
Boston & Cambridge & Somerville
Conclusion
Several factors affect trip generation for bikes, and this is different when looking at different cities and specifically at their bikeshare systems. From Part 2, we can see that temperature is the defining factor in this. From Part 3, we see that the number of docks available at stations, distances to restaurants and public transit stations are strong factors. Denser parts of cities have more of these, and these areas are exactly where trips generation is more (as well as overall bike ridership for commuting).
But, in both cities, there were others factors that affected trip generation more; in Philadelphia, income mattered most out of all the variables in this project, and age for Boston. Most of these variables and their importances are contextual. Thus, for bike planning, fewer standard variables should be used, and more contextual studies should be performed.